
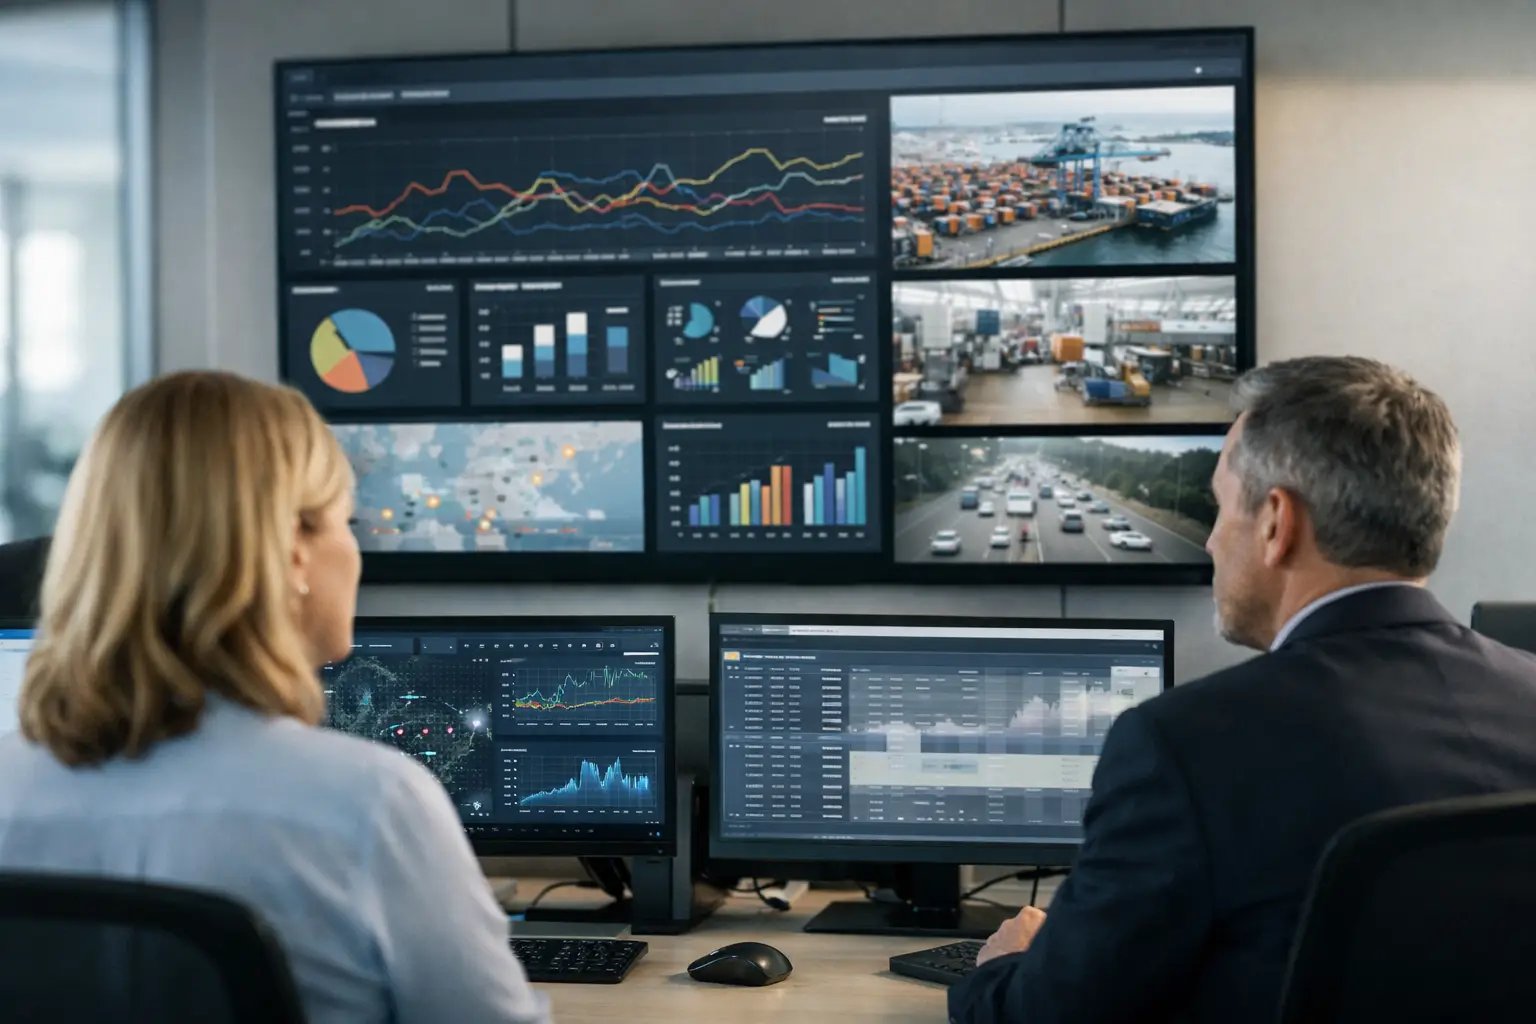
A regional operations team should not need to call five locations to learn whether a queue is building, a service counter is closed, or a critical display has gone offline. Visual analytics software brings those conditions into a governed operating view by converting camera feeds, sensor data, and device status into information teams can act on.
For organizations operating stores, restaurants, corporate sites, or control rooms across multiple markets, the issue is not access to data. It is turning distributed physical activity into reliable operational signals without creating another disconnected dashboard. The value comes from connecting visual intelligence to the systems, workflows, and communications channels that can change the situation.
Why visual analytics software is an operations issue
Cameras are often deployed for security, while digital signage, kiosks, electronic labels, and IoT sensors are managed as separate estates. This creates a fragmented view of the physical environment. Security may see traffic patterns, facilities may see equipment alerts, and retail operations may see transaction data, but no single team has the full context needed to respond quickly.
Visual analytics software can reduce that fragmentation. It analyzes defined conditions within video and sensor inputs, such as people counts, dwell time, queue length, zone occupancy, or movement through a location. These signals become more useful when they are correlated with operational data: point-of-sale activity, staffing schedules, service-level targets, device availability, or environmental readings.
The distinction matters. A people-counting metric alone may show that footfall increased. An operational view can show that footfall increased, two self-service kiosks are unavailable, and a queue threshold has been exceeded at a specific time. That is the difference between retrospective reporting and an actionable event.
This does not mean every camera feed should be analyzed for every possible condition. Broad, undefined monitoring produces noise, raises governance questions, and burdens teams with alerts they cannot prioritize. Effective programs begin with a small number of operational decisions that need better evidence.
The architecture behind reliable visual analytics software
A visual analytics deployment is only as useful as its architecture. Analytics models, cameras, network capacity, edge processing, cloud services, integrations, user permissions, and retention policies all affect whether the output is reliable enough for operational use.
At the edge, cameras or local processing resources can filter and process video near the source. This can reduce bandwidth demand and allow faster responses where network conditions vary between sites. Cloud infrastructure supports centralized administration, cross-site reporting, software updates, and long-term scalability. The right balance depends on latency requirements, connectivity, data governance, and the number of locations being managed.
The platform also needs a clear integration model. A queue event may trigger an alert in an operations console, update a management report, or activate a predefined message on a nearby display. A restricted-area event may be passed to a security workflow. A temperature anomaly may create a facilities ticket. Without integrations, visual analytics remains an isolated observation layer.
Governance is equally central. Enterprise teams need to know which data is collected, who can access it, how long it is retained, how models are configured, and how changes are logged. Role-based access, audit trails, encryption, monitored infrastructure, and documented operating procedures are practical requirements for systems supporting critical operations.
From observation to action with DEX Manager and C-Control
The strongest use case is not simply seeing what happens in a physical space. It is using the event to coordinate a response across that space.
DEX Manager provides centralized management for distributed digital communication networks, including commercial displays, videowalls, kiosks, electronic labels, and related endpoints. When visual analytics identifies a predefined condition, DEX Manager can support targeted communication: redirecting customers to available service points, displaying wait-time guidance, promoting a lower-traffic area, or issuing a location-specific operational message.
C-Control extends this model into control-room and command-center environments, where data sources, visual content, alerts, and operator workflows must be presented with consistency. For teams managing security, facilities, transport, or large corporate environments, the platform approach supports a common operating picture rather than a collection of independent screens.
SIA Interactive develops these proprietary platforms for environments where uptime, remote governance, and integration capacity are operational requirements. DEX Manager and C-Control can be deployed by SIA or through a certified partner network, with platform ownership providing a defined technology authority across the lifecycle.
Practical applications by operating environment
In quick-service restaurants, queue analytics can identify pressure at ordering, pickup, or drive-through zones. The response may be operational, such as opening another service point, or communicative, such as directing guests toward a self-order kiosk. The relevant metric is not only queue length but whether the intervention reduces abandonment, wait time, and pressure on staff.
Retail and supermarket operators can combine people counting, zone occupancy, and dwell patterns with digital signage and electronic label networks. This helps teams assess whether promotional zones are receiving attention, whether checkout capacity matches traffic, and whether store communications should adapt to current conditions. Analytics should support merchandising and labor decisions, not replace the judgment of store teams.
In banking and corporate environments, occupancy and flow information can support reception management, meeting-room utilization, visitor guidance, and service continuity. For security operations, visual rules can flag defined events in controlled areas and route them to the appropriate workflow. The operational objective is faster triage, not indiscriminate surveillance.
Control centers have different requirements. Operators need prioritized alerts, reliable visualization, and the ability to bring relevant sources together quickly during an incident. Visual analytics can reduce the amount of video requiring continuous manual attention, but it must be configured around verified operating procedures. In high-consequence environments, false positives and missed events both have a cost.
How to define a workable deployment
A useful starting point is a repeatable operational question. For example: when does a queue require intervention, who receives the alert, what action is expected, and how will the result be measured? This makes the project testable before analytics models, hardware choices, and integrations are expanded.
Next, assess the existing estate. Camera position, lighting, field of view, network quality, display availability, and local site conditions directly affect analytic performance. A model that performs well in a controlled test may produce inconsistent results when entrances are backlit, cameras are poorly positioned, or the scene changes frequently.
Then define ownership. Operations may own the response process, IT may own connectivity and identity management, security may own camera governance, and facilities may own local equipment. A deployment without clear responsibilities can generate alerts but no action. Escalation paths, maintenance windows, and acceptance criteria should be agreed before rollout.
Finally, measure the system as an operational service. Track device availability, alert volumes, response times, intervention outcomes, and model accuracy over time. Review thresholds regularly. A queue threshold appropriate for a weekday morning may be unsuitable during a seasonal peak, and static rules can become less useful as location behavior changes.
Trade-offs that procurement teams should examine
More data does not automatically produce better decisions. High-resolution video, extensive retention, and large-scale cloud processing can increase cost and governance exposure. Conversely, overly aggressive data reduction may limit investigation capability. The appropriate design depends on the use case and the organization’s operating model.
There is also a choice between a standalone analytics tool and an integrated physical-space platform. Standalone tools can fit a narrow requirement quickly. Integrated platforms require more planning but can connect analytics to signage, devices, control-room visualization, and centralized governance. For a pilot at one site, the first approach may be sufficient. For a network of hundreds or thousands of endpoints, the second usually creates a more manageable operating model.
Hardware selection should follow the analytic objective. Commercial-grade cameras, displays, sensors, and processing hardware need to be specified for the environment, duty cycle, and maintenance model. Consumer-grade components may appear economical initially but can complicate replacement, remote support, and continuity at scale.
The best visual analytics programs make physical operations easier to govern, not harder to interpret. Start with a decision that matters, connect the signal to a defined response, and build the architecture needed to operate that process reliably across every location.