
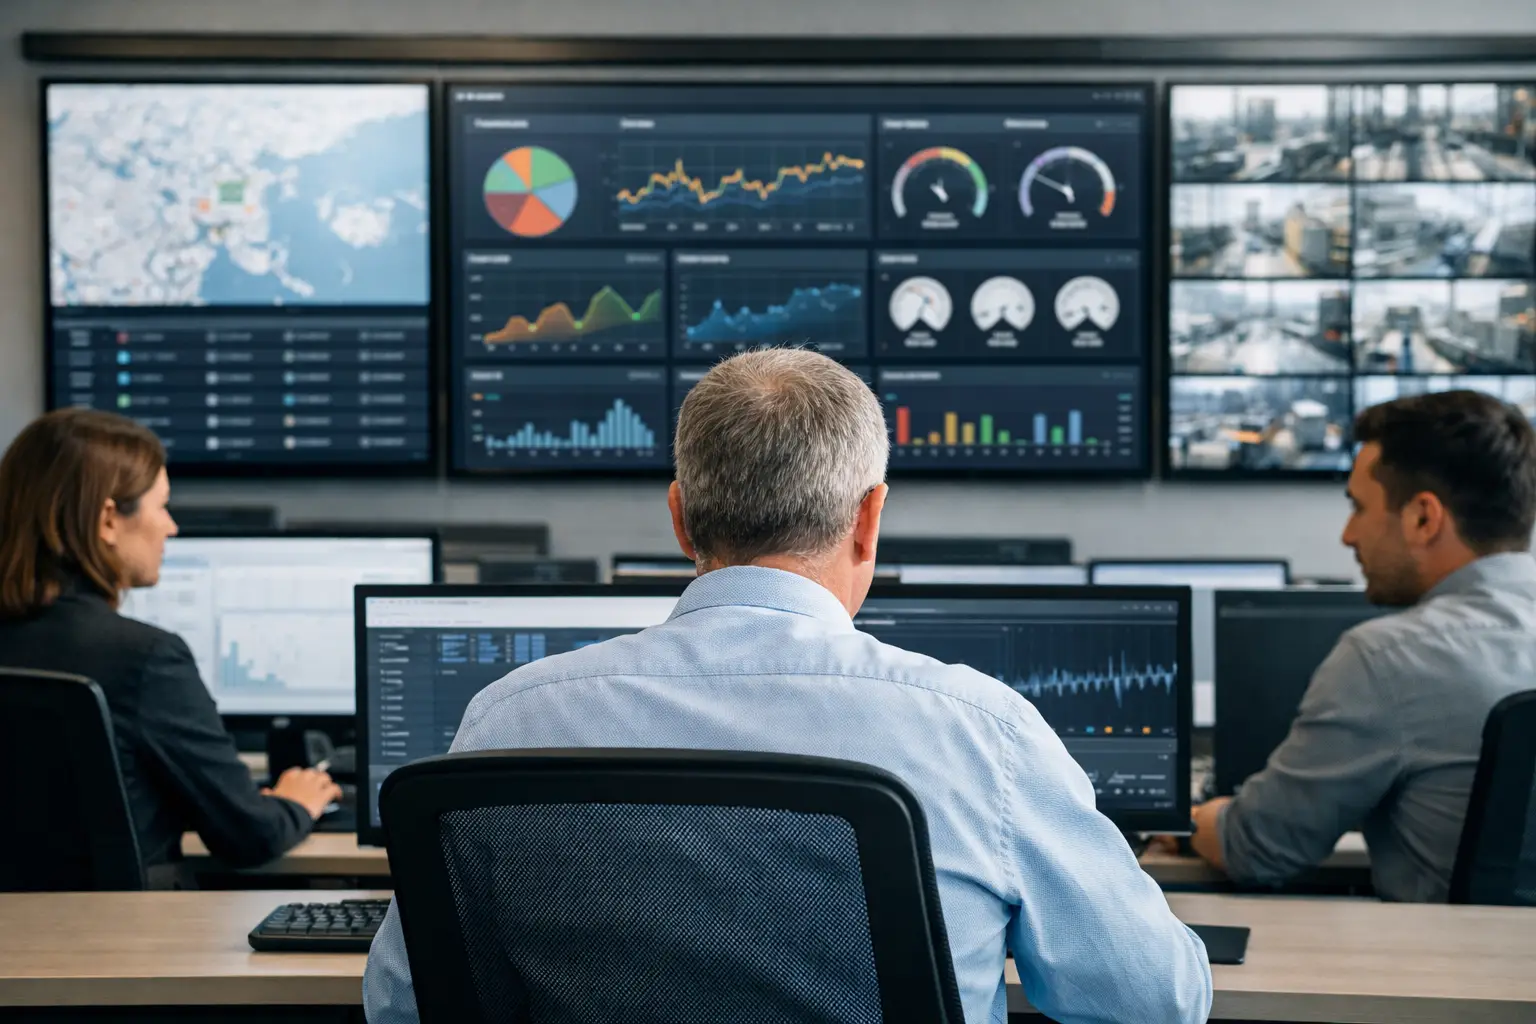
A control room can have every data source available and still miss the incident that matters. The failure is rarely a lack of screens. It is a lack of hierarchy: too many unconnected alarms, unclear ownership, stale status information, and no practical route from observation to action. The best control room dashboards solve that operational problem by turning distributed signals into a shared, governed view of what requires attention now.
For enterprises operating physical networks - from retail estates and restaurant chains to corporate campuses, transport environments, and security operations - a dashboard is not a presentation layer. It is part of the operating model. It must support continuity, escalation, auditability, and decisions made under time pressure.
What Makes a Control Room Dashboard Effective
A useful dashboard does not attempt to show everything at once. It gives operators the context to distinguish a local device issue from a service-wide event, a temporary exception from a recurring fault, and an alert that can wait from one that threatens customer experience or operational continuity.
That requires a clear information architecture. At the highest level, operators need a concise view of network health, active incidents, critical assets, service-level performance, and geographic or organizational impact. From there, they should be able to move into a region, site, device group, or individual endpoint without changing systems or relying on manual reporting.
Visual design matters, but operational design matters more. Color indicators should communicate defined states, not decorate the interface. A red status should have a consistent meaning, a known owner, and an escalation path. Trend charts should show whether a condition is improving or deteriorating, not simply confirm that an event occurred. Maps, floor plans, and video walls should add spatial context where it helps teams act faster.
The result is control rather than visibility alone. Visibility tells a team that 40 displays are offline. Control identifies whether they belong to one location, one network segment, one content deployment, or one hardware model - and provides the information needed to assign and resolve the issue.
Best Control Room Dashboards Start With Operational Priorities
There is no single dashboard layout that is best for every organization. A security operations center, a digital signage operations team, and a facilities command center do not prioritize the same events. The strongest implementations begin with critical operating questions rather than a catalog of available data.
For a distributed digital signage network, those questions may include: Which screens are offline? Which campaigns have failed to publish? Are priority messages running at the right locations? Has a player lost connectivity, or is the screen itself unavailable?
For facilities and physical-space operations, the focus may shift to occupancy, environmental thresholds, access events, queue conditions, equipment status, and site availability. In a corporate environment, communications teams may need confirmation that emergency messages have reached specific screens, while IT requires evidence that underlying devices are online and compliant.
A dashboard should be designed around these distinct roles. Executives typically need an exception-based view of service performance and risk. Supervisors need to see workload, incident status, and regional patterns. Operators need detailed diagnostics and direct action controls. Trying to satisfy all three audiences through one dense screen usually creates an interface that serves none of them well.
Prioritization Must Be Configurable
A failed screen in a staff corridor does not carry the same operational weight as a failed screen at a bank branch entrance, an airport wayfinding point, or a quick-service restaurant menu board during peak hours. The dashboard needs rules that reflect that difference.
Priority can be based on location, device type, business hours, customer-facing impact, service ownership, or the number of affected endpoints. This lets the control room focus on business criticality rather than raw alert volume. It also creates more reliable escalation, because the system can route events according to defined governance rules instead of relying on an operator's personal knowledge of each site.
The Capability Stack Behind Reliable Dashboards
A dashboard is only as credible as the data feeding it. If device status updates are delayed, integrations are incomplete, or different platforms use conflicting asset names, operators lose confidence and return to spreadsheets, calls, and manual checks.
The required architecture starts with centralized device management. Each endpoint needs a known identity, location, configuration, connectivity status, and ownership model. From there, the platform can collect health data from commercial displays, media players, LED systems, kiosks, sensors, cameras, and other connected assets.
C-Control is designed for this type of command environment. It provides a centralized operational layer for monitoring distributed technology, organizing endpoints by site or function, and presenting real-time status through configurable control room views. It can support control rooms that manage a mix of communication, self-service, and physical-space technology rather than treating each device category as an isolated estate.
Integration is equally important. A control room dashboard should not require operators to infer conditions from disconnected tools. IoT sensor data can provide context for occupancy, temperature, or equipment conditions. Camera feeds can support visual verification where governance permits. Ticketing or service management integration can preserve the handoff from detected issue to assigned work order. Content and device management data can show whether a display failure is technical, network-related, or linked to an incorrect schedule.
DEX Manager can complement this model for organizations managing digital signage at scale. Its content, scheduling, proof-of-play, and device management capabilities create the operational data needed to confirm that communications are not only published but running as intended across the network.
Real-Time Data Needs Historical Context
A live status tile is necessary, but it rarely explains why a problem is happening. Effective dashboards retain historical information: recurring offline events, average time to resolve, connectivity trends, content publication failures, and incident concentration by site or hardware category.
This turns the control room into a source of improvement, not only response. If a particular location repeatedly experiences player disconnections at a specific hour, teams can investigate network conditions. If a hardware model creates a disproportionate number of service tickets, procurement and engineering have evidence for replacement planning. If content failures increase after a workflow change, the organization can revise approval or deployment controls.
The trade-off is data volume. Collecting every possible metric creates cost, noise, and governance challenges. Retain the data that supports accountability, service optimization, and operational decisions. Archive or aggregate what is needed for trend analysis, and avoid loading real-time screens with diagnostics that operators only need during deeper investigation.
Designing for Continuity, Not Just Normal Operations
The most revealing test of a control room dashboard is what happens during a major incident. When a regional connection fails, a content deployment goes wrong, or an emergency communication must be issued across thousands of endpoints, teams need a system that reduces ambiguity.
This means dashboards should support predefined incident modes. A normal operations view can prioritize daily service health and exceptions. An incident view can group affected assets, show the scope by region or business unit, surface relevant dependencies, and provide a clear status narrative for operational leadership. The same underlying data should be available, but the interface should reflect the urgency of the situation.
Governance is central here. Organizations need to know who acknowledged an alert, when a device status changed, which command was issued, and whether the action succeeded. Audit trails are particularly relevant when control rooms oversee customer communications, security-sensitive locations, self-service devices, or regulated environments.
Platform availability also belongs in the dashboard decision. A well-designed interface has limited value if its underlying service cannot support the organization during an incident. Consider cloud architecture, access controls, role-based permissions, security certification, monitoring coverage, backup processes, and 24/7 operational support. These are not procurement checkboxes. They determine whether control is maintained when normal conditions break down.
Common Dashboard Failures to Avoid
The first failure is treating the video wall as the control room. Large screens are valuable for shared situational awareness, but they should not become a static collection of charts. A video wall works best when it presents a concise common operating picture, while individual operator workstations provide drill-down, action controls, and case-level detail.
The second is measuring only device uptime. A device can be online while delivering the wrong content, showing an error state, or operating outside the conditions that matter to the business. Combine technical health with service outcome metrics such as successful content delivery, kiosk availability, queue thresholds, or completion of priority messaging.
The third is allowing every team to create its own definitions. If one department defines an offline device after five minutes and another after 30, the organization cannot compare performance or manage a consistent service level. Establish common status logic, then allow controlled variations for business criticality.
Finally, avoid a dashboard project that ends at deployment. Asset estates change, new integrations are added, and operating procedures evolve. Dashboards require periodic review with the people who use them under pressure. The best refinements often come from a simple question after an incident: what did the operator need to know or do that the current view did not support?
A control room dashboard earns its place when it shortens the distance between a signal and a responsible action. Build around that standard, and the screens become more than monitoring displays: they become a dependable part of operational governance across every site, device, and service the organization is accountable for.