
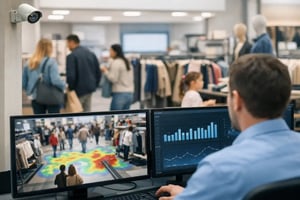
A store can appear busy and still underperform. The issue is rarely a lack of people entering the location. It is the lack of operational visibility into where they go, where they wait, which messages they see, and when demand exceeds available staff or service capacity. Store traffic analytics with AI converts those physical signals into measurable operational data, allowing retail leaders to manage stores with more than sales reports and manual observation.
For multi-site retailers, the challenge is not installing a camera or producing a footfall count. It is creating a governed architecture that delivers comparable data across locations, integrates with existing digital signage and operational systems, and remains available when individual stores are operating at peak demand. That is where an AI-enabled analytics platform becomes part of the retail operating model rather than another isolated dashboard.
Why footfall data alone is not enough
Traditional footfall reporting answers a narrow question: how many people entered a store? That number can be useful for comparing locations, assessing campaign impact, or calculating conversion against transactions. But it does not explain the conditions behind performance.
A retail operations team also needs to understand traffic direction, dwell time by zone, queue formation, congestion around promotions, and the difference between a busy entrance and a busy service area. A supermarket may need to identify recurring pressure at fresh-food counters. A bank branch may need visibility into waiting areas and self-service adoption. A QSR operator may need to distinguish customers waiting to order from customers waiting to collect.
AI analytics adds context to these signals. Computer vision models can detect movement patterns, count people in defined zones, estimate queue length, and identify threshold events without requiring staff to manually observe screens throughout the day. The output becomes useful when it is connected to action: staff allocation, digital content changes, service alerts, or layout reviews.
This distinction matters because high traffic is not automatically positive. If visitors cluster around an unclear promotion, abandon a queue, or bypass a service zone, volume may expose an operational problem rather than commercial success.
Store traffic analytics with AI must connect to operations
The value of AI is determined by the workflow around it. A store manager does not need another report delivered after the trading day has ended if a queue has already affected customer experience for two hours. Operational teams need defined rules, real-time visibility, and accountability for how exceptions are handled.
DEX Manager provides the central software layer for this model. It can manage distributed digital signage, connected hardware, IoT sensors, and camera-based analytics through one controlled environment. Instead of treating traffic data, customer communication, and device operations as separate systems, the platform can coordinate them according to operational conditions.
For example, a queue threshold at a service desk can trigger a predefined response. Content on nearby displays can direct customers to an alternative counter, promote self-service options, or communicate expected waiting instructions. A notification can be sent to the appropriate operational role. The event and response can be retained for traceability, allowing regional teams to assess whether the rule was effective across multiple stores.
This is more useful than a generic claim of real-time insight. It creates a measurable chain from physical event to system response to operating outcome.
From observation to automated response
The most effective use cases begin with a specific operational question. Where do queues create a material service risk? Which zones receive high dwell but low conversion? When does traffic justify activating additional checkout capacity? Which store layouts create recurring congestion?
Once the question is clear, teams can define zones, thresholds, schedules, and escalation paths. The AI model supplies the detection capability, while the platform supplies governance and execution. That separation is important. Analytics can identify a condition, but an enterprise platform determines who can change a rule, which locations receive it, how it is approved, and whether the connected devices successfully execute it.
A well-designed deployment avoids automating every event. A sudden increase in visitors may warrant a content change but not a staffing alert. A sustained queue over a defined period may require both. The right threshold depends on store format, operating hours, staffing model, and customer expectations.
Build a reliable analytics architecture
Camera analytics is only one part of the architecture. The data must be collected, processed, retained, and presented in a way that supports continuity of operations and appropriate governance.
First, retailers need a consistent definition of zones and events. If one location defines a queue from the entrance and another defines it from the service counter, cross-store comparison becomes unreliable. Standard zone templates and operational rules help regional teams compare like with like while allowing controlled local variations.
Second, the infrastructure must account for device uptime and connectivity. A distributed retail estate includes displays, media players, cameras, sensors, kiosks, and network dependencies. If a device loses connection, teams need remote monitoring, incident visibility, and a clear record of what content or configuration was active. Analytics has limited value if the display intended to respond to an event is offline.
Third, security and data governance need to be designed into the deployment. For many traffic use cases, retailers can use anonymized counts, movement patterns, and zone-level events rather than collecting identifiable customer data. The appropriate design depends on the use case, the selected hardware and analytics configuration, internal policy, and applicable requirements. Organizations should define data access, retention, auditability, and ownership before scaling beyond a pilot.
DEX Manager supports centralized governance across large device fleets while allowing authorized teams to manage local content and operating conditions. This is particularly relevant for organizations operating across regions, where consistency matters but individual locations may have different formats, languages, or service processes.
Use traffic intelligence where it affects performance
Traffic analytics becomes commercially relevant when it is applied to decisions that store teams and central functions can influence. The following applications are common across high-volume physical environments:
- Queue management: Monitor waiting areas and trigger alerts, staff escalation, or customer-facing guidance when defined thresholds are exceeded.
- Digital signage optimization: Compare traffic and dwell patterns by zone to determine whether promotional content is positioned where customers actually spend time.
- Store layout assessment: Identify bottlenecks, low-visibility areas, and high-interest zones before committing to permanent layout changes.
- Labor planning: Use historical traffic profiles to improve staffing schedules by daypart, campaign period, and location type.
- Campaign measurement: Assess whether a campaign increased visits to a target area, not only whether sales changed afterward.
- Self-service adoption: Measure whether kiosk guidance, wayfinding, or digital prompts reduce pressure on staffed service points.
Pair AI insights with digital communication
The strongest deployments pair visual analytics with a communication channel that can respond immediately. If traffic is only visible in a back-office dashboard, the organization can analyze performance but may not improve the customer experience in the moment.
Digital signage provides that response layer. Content can be scheduled by time, store, or business condition, while analytics can provide evidence of whether the communication is reaching the intended area. For example, if a promotional zone receives limited traffic, the issue may be content relevance, placement, route design, or all three. AI analytics does not replace commercial judgment, but it reduces the reliance on anecdote.
For enterprise organizations, this coordination also creates a clearer division of responsibility. Marketing can govern approved campaign content. Operations can define service thresholds. IT can oversee access, integration, and device health. Store teams receive only the actions that require local execution. The platform becomes a common operational layer without forcing every team into the same workflow.
Scale carefully from pilot to estate-wide deployment
A pilot should prove more than camera accuracy. It should test whether the organization can act on the output. Before expanding, assess the reliability of detections, the relevance of alerts, the response time of store teams, and the impact on queues, service levels, or conversion-related behavior.
It is also worth testing edge cases. Seasonal peaks, temporary displays, changes in lighting, store refits, and atypical customer flows can affect analytics performance. A controlled pilot exposes these conditions before the rules are applied across hundreds of locations.
Once the model is validated, the priority shifts to repeatability: standardized hardware specifications, approved zone templates, role-based access, centralized monitoring, and documented support procedures. DEX Manager can be deployed by SIA Interactive or through its certified partner network, supporting a consistent platform approach while adapting delivery to the organization’s operating model.
The practical goal is not to make every store behave identically. It is to give every location a reliable way to detect operational pressure, communicate clearly with customers, and provide central teams with evidence for better decisions. When traffic intelligence is tied to governed actions, a store becomes easier to operate before the customer experience starts to fail.