
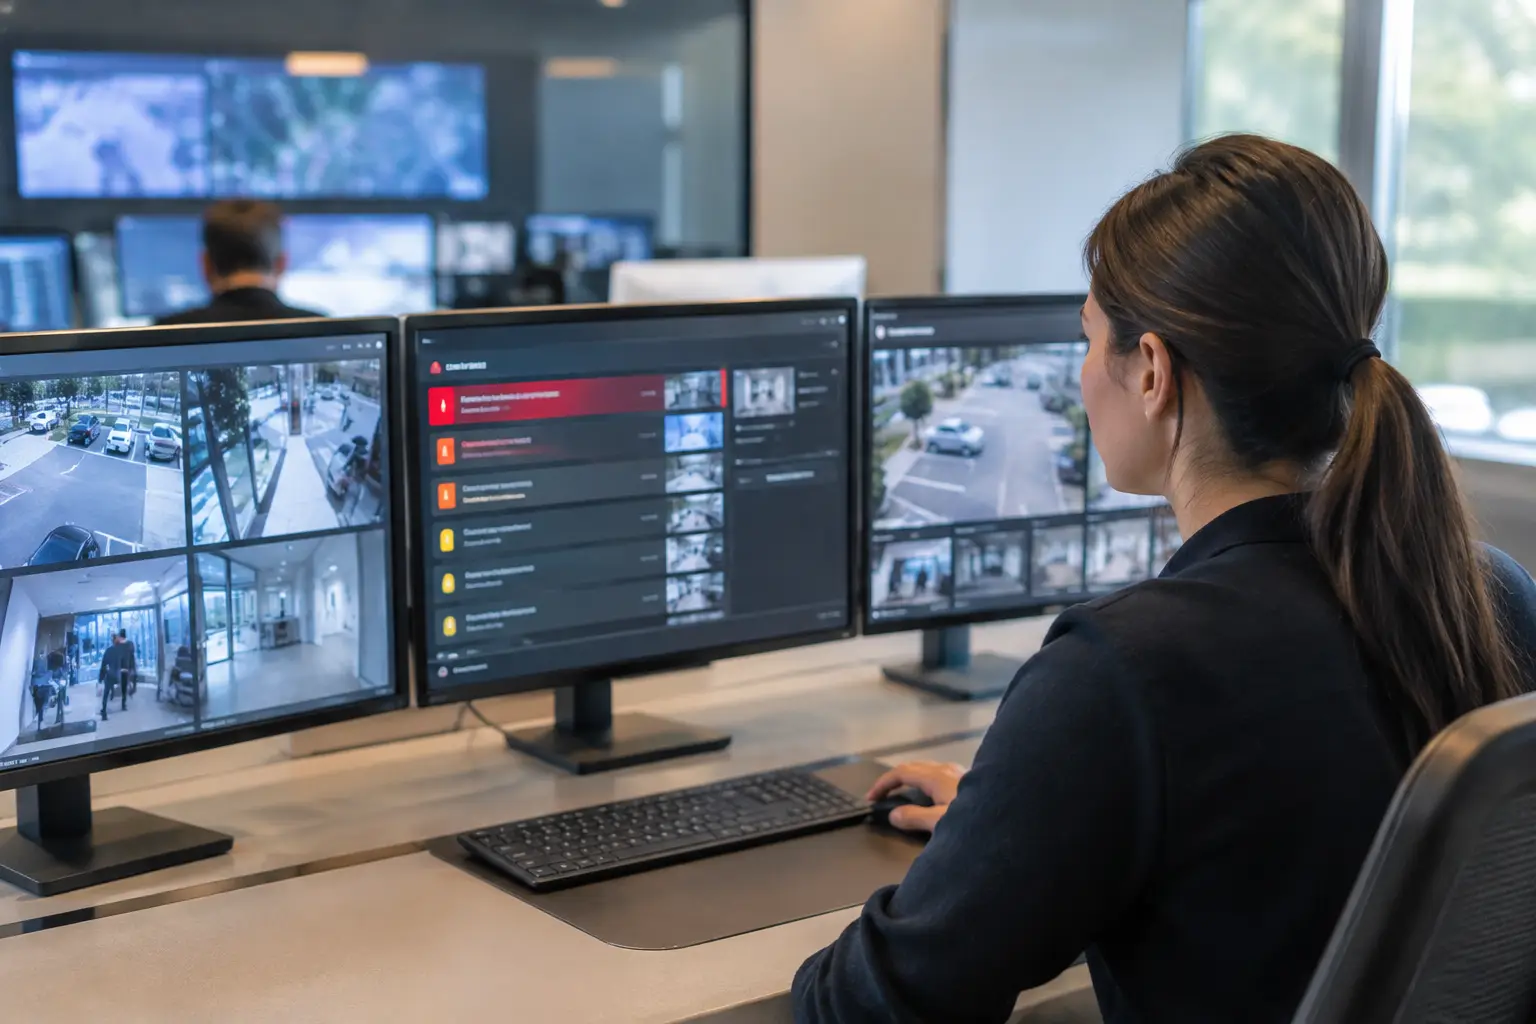
A control room can display thousands of live data points and still leave operators uncertain about the one action that cannot wait. Dashboard alert prioritization addresses that gap by turning alarms, device states, sensor events, and application exceptions into a clear operational order. In C-Control, configurable views and multi-source visualization provide the structure to present the right condition, in the right context, to the right operational role.
The objective is not to make every anomaly more visible. It is to protect continuity of operations by separating conditions that require immediate intervention from those that can be monitored, assigned, or resolved through planned maintenance. That distinction determines whether a dashboard supports decisions or simply adds another stream of notifications.
Dashboard Alert Prioritization Starts in C-Control
C-Control is designed to centralize the visualization of multiple operational sources in a single control-room environment. Security systems, IoT sensors, building-management platforms, network monitoring tools, cameras, digital signage estates, and line-of-business applications can be represented in configurable dashboards according to the organization’s operational model.
Dashboard alert prioritization should therefore be designed as part of the view architecture, not added as a cosmetic layer after integrations are complete. A color, icon, status indicator, map element, or alert panel only has value when its meaning is governed consistently. Operators need to understand whether an event is an immediate service interruption, a developing risk, a service request, or an informational change without opening multiple source systems.
C-Control can provide the consolidated visual layer, while the originating platform continues to generate the underlying alarms and status changes. The exact behavior depends on the source system, available interfaces, and the integration design. This matters because alert logic should remain traceable: the source identifies a condition, the integration carries its relevant data, and the control-room view applies a consistent operational presentation.
Build Priority From Operational Consequence
The most common alerting failure is assigning priority solely by technical severity. A device that reports an error is not automatically a critical operational incident. Its priority depends on what it supports, where it is located, how many users are affected, whether redundancy exists, and who can respond.
A practical model combines four factors: operational impact, urgency, scope, and recoverability. A failed display in a back-office corridor may be a maintenance item. The same failure on a departure-information videowall, a safety communication screen, or a customer service kiosk can require immediate action. The technical event may look similar, but the business consequence is not.
Separate urgency from visibility
Every event should be visible somewhere, but not every event should interrupt an operator. Critical alerts should occupy the primary operational view and remain visible until they are acknowledged or cleared according to the defined workflow. High-priority alerts may require prompt investigation but can coexist in a dedicated queue. Medium and low-priority conditions are often better handled through filtered views, maintenance dashboards, or scheduled reporting.
This approach reduces alert fatigue without suppressing traceability. A control-room team can still review recurring device warnings or communication losses, but those events do not compete with conditions that affect safety, service availability, or revenue-generating operations.
Define priority with owners, not only labels
Priority labels need an accountable response path. A red status without an assigned operational owner creates escalation by assumption. For each category, define who monitors it, who investigates it, what information they need, and when the issue moves to another team or certified partner.
For example, an offline player within a digital signage network may first be routed to a regional support team. A wider communication outage affecting multiple screens could be presented to central operations because the scope indicates a potential network or platform issue. C-Control dashboards can organize these conditions by site, asset group, operational zone, or service, helping teams work from responsibility instead of searching through a flat alarm list.
Design Views for Fast Triage
A well-prioritized dashboard does not place every alert in a single panel. It gives operators an immediate overview, then allows them to move into the context required for a decision. C-Control’s configurable views can support this layered approach with summary indicators, maps, device groups, camera feeds, operational KPIs, and source-specific data in one environment.
The primary view should answer three questions in seconds: What is critical now? Where is it happening? Who or what is affected? A secondary view can then show the affected asset, related events, live camera context, device status, or the data points that explain the condition.
Color is useful, but color alone is insufficient. Use status text, icons, labels, and consistent placement so operators can distinguish a critical failure from a warning even under pressure or on a densely populated videowall. Avoid reserving red for every disconnected endpoint. If red becomes routine, the dashboard loses its strongest visual signal.
Time also changes priority. A kiosk issue during peak service hours may deserve higher placement than the same issue overnight. A temperature threshold may be a warning for several minutes but become critical if it persists, rises, or affects protected equipment. Where source data and operational rules support it, dashboards should reflect these contextual changes rather than treating all events as static.
Preserve Governance Across Sources
Multi-source visualization introduces a governance challenge: each system may use different severity terms, timestamps, identifiers, and alarm logic. One platform may call an event “major,” another may call it “high,” and a third may only expose a numeric threshold. Presenting these labels unchanged can confuse operators and weaken incident coordination.
Define a common priority taxonomy before configuring the dashboard. The taxonomy should establish the organization’s meaning for critical, high, medium, and low conditions, including expected response windows and escalation rules. Source-level terms can then be mapped to the operational language used in the control room.
This does not mean erasing source detail. C-Control views should retain enough information for operators and technical teams to identify the originating system, asset, timestamp, and condition. Traceability is essential when an alert is reviewed after the event, handed to another team, or used to refine thresholds. A central dashboard is most effective when it standardizes the operator experience while preserving the evidence behind each status.
Governance also includes change control. When teams add a new sensor type, signage location, camera, or facility system, they should define its priority rules before it reaches the live operational view. Otherwise, alert panels gradually become inconsistent as each integration brings its own assumptions.
Apply the Model to Real Operational Scenarios
In retail and quick-service environments, the criticality of a digital screen or self-order kiosk depends on its role in the customer journey. A promotional display may tolerate a short interruption, while a self-service ordering estate during a lunch peak may require immediate attention. A centralized C-Control view can show affected locations, device groups, and connected operational data so teams can distinguish a local device fault from a broader service issue.
For facilities and infrastructure operations, sensor alerts require correlation with location and asset importance. An environmental warning in a low-risk area should not receive the same visual treatment as a condition affecting a server room, electrical asset, or controlled-access zone. Combining sensor data with maps, camera views, and equipment status gives operators more decision-ready context.
Security operations often need the reverse discipline: a single high-priority event may be significant even when the overall number of alerts is low. In that case, the dashboard should prioritize event location, relevant camera feeds, access-control information, and the escalation owner rather than presenting a generalized device-health view.
Make Priority Operational, Not Decorative
Priority models need regular review. If operators repeatedly dismiss a category, investigate whether the threshold is too sensitive or whether the event belongs in a maintenance workflow. If incidents are discovered outside the dashboard, assess whether the source integration lacks the necessary data or whether the visual hierarchy is hiding meaningful conditions.
The best measure of dashboard alert prioritization is not the number of alerts displayed. It is whether an operator can identify the next necessary action with confidence. When C-Control is configured around operational criticality, ownership, context, and traceability, the control room becomes a practical decision layer for the systems it brings together.