
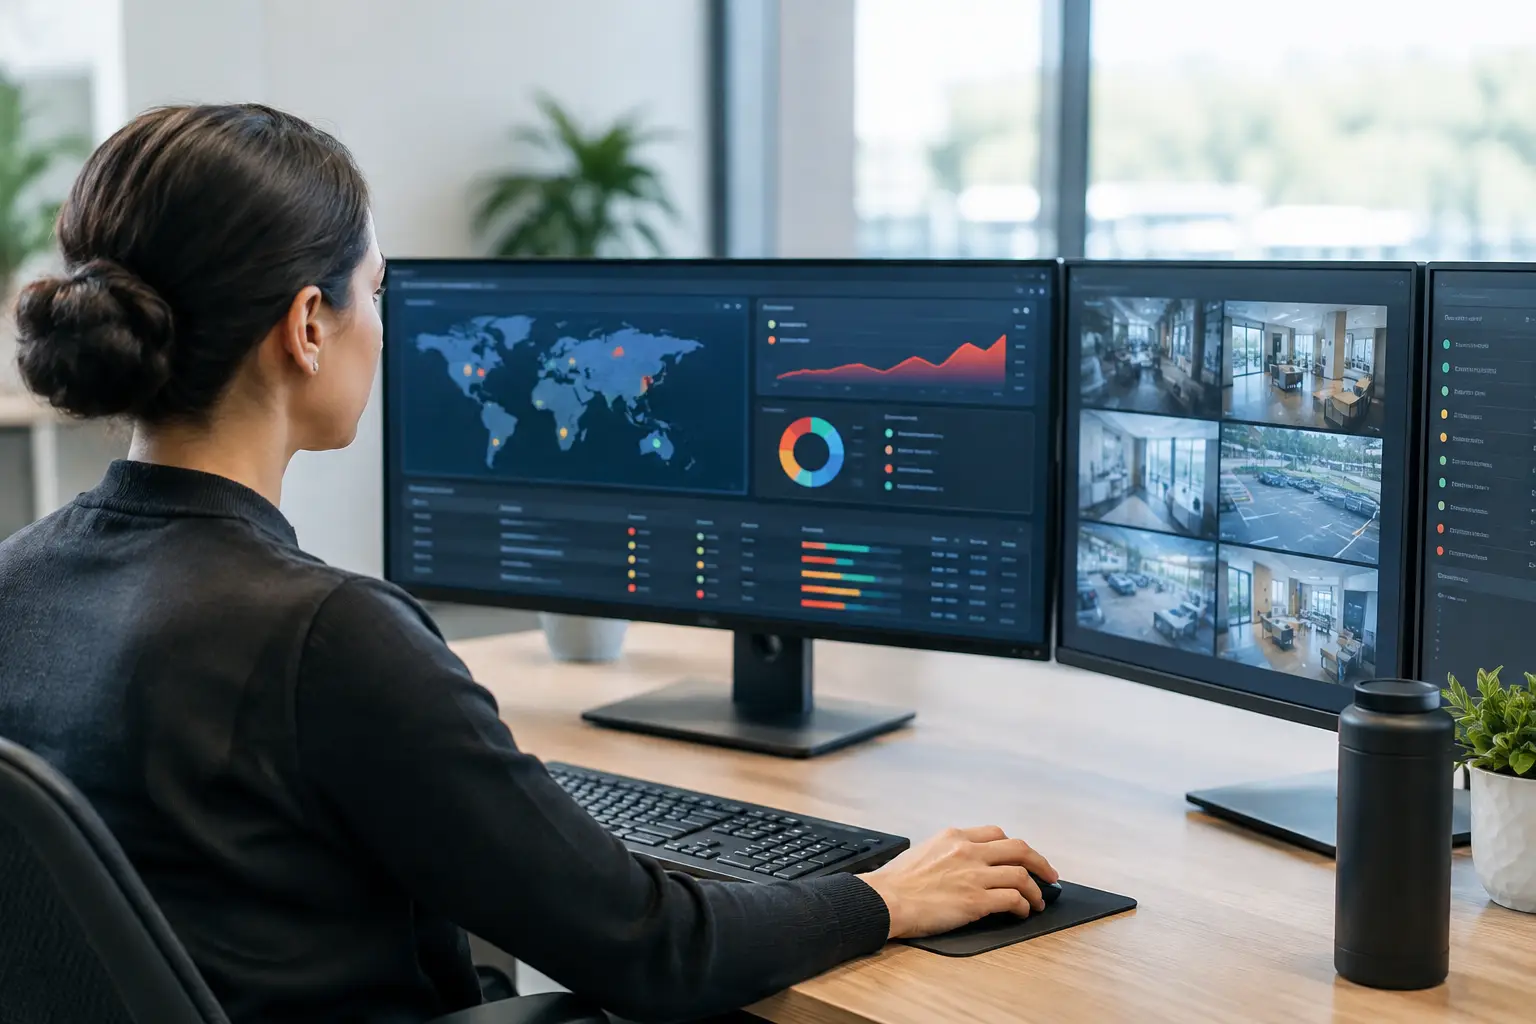
A control room can receive hundreds of alerts while the incident that affects operations remains unclear. A display may be offline, a kiosk payment workflow may be failing, a camera stream may be unavailable, or an IoT sensor may be outside its defined threshold. The challenge is not collecting more telemetry. It is to configure incident response dashboards that identify operational impact, assign ownership, and show whether recovery is progressing.
For distributed physical networks, a dashboard is part of the operating model. It must help teams protect continuity across sites, devices, applications, and connected services without forcing operators to assemble the incident picture from separate monitoring tools, email threads, and phone calls.
Start With the Operational Decision
The first configuration decision is not visual. It is governance: what must an operator decide from this dashboard, and within what time frame?
A facilities team may need to determine whether a temperature exception threatens stock or customer safety. A retail technology team may need to see whether a payment or self-service kiosk failure is isolated to one device or tied to a network segment. A corporate communications team may need confirmation that critical emergency messaging reached every screen in a defined zone. These are different decisions, so they should not be forced into a single generic dashboard view.
Define the dashboard around incident classes that reflect business impact. For many organizations, this means separating service availability incidents from security events, environmental exceptions, content delivery failures, and device-health degradation. The same technical condition can carry different priority depending on location, operating hours, and the role of the endpoint.
A disconnected back-office display may be scheduled for maintenance. A disconnected menu board at a high-volume restaurant during peak trading hours may require immediate action. The dashboard needs enough operational context to make that distinction visible before a ticket is created.
Configure Incident Response Dashboards Around Impact
An effective incident dashboard answers four questions in one screen: what is affected, how severe is the impact, who owns the response, and what has changed since the incident began. If any of these answers depends on manual investigation, the dashboard is monitoring activity rather than supporting response.
Build a clear priority model
Severity should not be based only on the type of alert. It should combine technical state with operational criticality. A practical model uses priority rules based on the affected service, the number of endpoints, site classification, time of day, and whether a workaround exists.
For example, a single offline self-order kiosk may be a medium-priority incident if other lanes remain available. If all kiosks at the same location become unavailable, the priority should rise automatically because the event affects transaction capacity and queue management. Similarly, a failed video wall controller in a security operations environment deserves a different escalation path from a noncritical screen in a meeting area.
Avoid excessive priority bands. Teams generally act more consistently with three or four levels that have explicit response expectations. Every level should define the acknowledgement target, escalation route, update cadence, and restoration target. This creates traceability without requiring operators to interpret vague labels such as “urgent.”
Organize the dashboard by service and location
Device lists alone do not show operational impact. Group assets into services and locations that reflect how the organization runs its physical network. A service could be digital ordering, branch communications, safety messaging, refrigeration monitoring, or control room visualization. Locations may be individual stores, regional clusters, floors, transport hubs, or campuses.
The primary view should show the current incident count by severity, alongside the services and locations affected. From there, operators need to move quickly to an incident-level view containing the endpoint identity, last known status, relevant telemetry, assigned team, and response timeline.
This hierarchy matters at scale. A national retailer does not need a wall of thousands of endpoint alerts. It needs to know which service has lost availability, whether the event is localized or systemic, and whether the correct regional support team has accepted the task.
Use status colors with discipline
Color can accelerate recognition, but it cannot carry the full meaning of an incident. Reserve red for active high-impact conditions requiring action. Use amber for degraded states or pending intervention, green for confirmed normal operation, and neutral colors for maintenance windows, suppressed alerts, or unavailable telemetry.
Pair every color with a text status and timestamp. This supports accessibility and prevents false confidence when a device reports online but the application or connected peripheral has failed. A screen may have network connectivity while content playback is stalled. A kiosk may be online while its printer or card terminal is unavailable.
Connect the Signals That Explain the Incident
A useful response dashboard combines device monitoring with the signals that explain whether the business service is functioning. This is where platform architecture matters. If endpoint health, content status, sensor data, and operator actions sit in disconnected systems, teams lose time correlating events under pressure.
C-Control provides a centralized environment for monitoring and controlling connected physical infrastructure, including displays, kiosks, IoT devices, cameras, and related operational workflows. Its value in incident response is not a single alert feed. It is the ability to place device state, location context, automation rules, and control actions within the same operational view.
Configure the dashboard to collect only signals that lead to a defined action. Typical categories include:
- Connectivity and device heartbeat, including last contact time and repeated disconnections.
- Application and content status, such as playback failures, campaign delivery exceptions, or unavailable interactive workflows.
- Peripheral and hardware state, including display power, media player health, printer status, kiosk components, and controller availability.
- Environmental and security telemetry, such as temperature thresholds, door states, occupancy, camera health, or sensor tampering.
Design Escalation as a Workflow, Not a Notification
An alert becomes an incident when it requires accountable action. Configure workflow rules so that a detected condition creates the right operational path: acknowledge, assess, dispatch or remediate remotely, verify recovery, and close with an auditable record.
Automation is most effective when it addresses known, low-risk recovery actions. A device that stops responding may be restarted remotely according to policy. A content player with a failed campaign download may receive a republish command. A sensor breach may trigger a predefined message on nearby screens while the relevant team is notified. Each automation should record the trigger, action, result, and operator override when one occurs.
Not every condition should be automated. Repeated restarts can conceal a hardware issue, and automatic suppression can hide a developing site-wide outage. Use escalation rules that detect recurrence, failed remediation, and correlated incidents across multiple endpoints. When those thresholds are met, route the event to the appropriate regional operations, IT, facilities, security, or certified partner support team.
The dashboard should also distinguish between an incident that is acknowledged and one that is genuinely under control. Show the current owner, last action, elapsed response time, next escalation deadline, and restoration evidence. This prevents incidents from disappearing into a queue after an initial acknowledgement.
Configure Views for Different Operating Roles
A single executive dashboard cannot replace an operator console, and an operator console is not a useful leadership report. Build role-based views from the same governed data.
Operators need active incidents, response timers, device controls, and diagnostic detail. Regional managers need service availability by location, unresolved incident aging, and repeat-failure patterns. Technology leaders need trends that expose structural issues: recurring network instability, hardware models with elevated failure rates, sites with poor recovery performance, and incidents outside agreed response targets.
For critical environments, include a shift-handover view. It should show open incidents, actions already taken, temporary workarounds, pending field visits, and risks expected during the next operating period. This reduces dependency on informal handover notes and preserves continuity across 24/7 teams.
Validate the Dashboard Under Real Conditions
A dashboard that looks complete in a configuration session may fail during an actual disruption. Test it using incident scenarios, not only sample alerts. Simulate a regional connectivity outage, a cluster of failed displays, a kiosk component failure, and an out-of-range sensor reading. Confirm that priority, ownership, notifications, remote actions, and closure evidence behave as intended.
Review false positives and missed conditions after each test or production incident. Too many alerts train teams to ignore the dashboard. Too little sensitivity delays intervention. The right threshold is rarely permanent because device populations, site operations, and service expectations change over time.
SIA Interactive's platform approach supports this governance model by centralizing the operational layer while allowing deployment through SIA or a certified partner network. The objective is consistent control across a distributed estate, regardless of who manages local delivery and support.
The best incident response dashboard is not the one with the most data. It is the one that gives the right person enough verified context to take the next correct action before a technical fault becomes an operational interruption.